We're making a change to the approach we use to assign Morningstar Medalist Ratings to funds starting in late October 2024. While we've been encouraged by the Medalist Ratings' performance thus far, the change is aimed at further improving their predictiveness. That, in turn, should confer even better outcomes to investors who incorporate the Medalist Ratings into their decisions.
We expect around 20% of rated funds to see a rating change because of this methodology enhancement, most of those being downgrades. As a result, we expect the Medalist Ratings distribution to shift, with Gold, Silver, and Bronze ratings projected to account for around 23% of rated global funds compared with about 30% today.
Percentage Breakdown of Morningstar Medalist Ratings
We expect the Medalist Rating distribution to shift from Gold, Silver, and Bronze toward Neutral and Negative as a result of the rating enhancement.
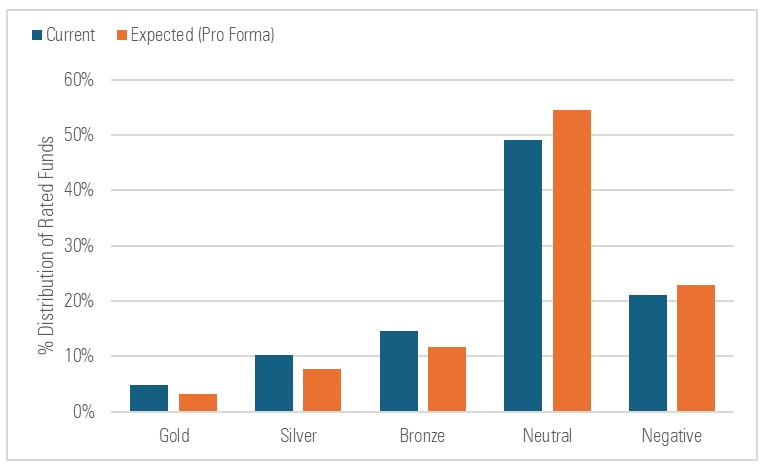
Source: Morningstar. Data as of July 31, 2024. Includes all rated vehicles globally.
In this commentary, I'll walk through the change we're making to the Medalist Rating and the rationale behind it. I'll also summarize the change's expected impact by asset class and coverage type, and walk through the timing of the change.
About the Medalist Rating
The Medalist Rating is a forward-looking system that aims to predict funds' performance versus a relevant benchmark index or peer group. It takes the form of Gold, Silver, Bronze, Neutral, and Negative, with higher ratings denoting our conviction in a fund's ability to outperform and lower ratings indicating a lack of conviction.
We assign Medalist Ratings in two ways—by analyst or by algorithm. Analysts assign Medalist Ratings to funds that they cover based on the qualitative evaluation they conduct. We employ a machine-learning algorithm to assign Medalist Ratings to the funds that analysts don't cover. All told, we assign Medalist Ratings to nearly 200,000 managed investment vehicles globally.
Medalist Rating Performance
We've been encouraged by the Medalist Rating's performance since we launched it in 2011. It has done a good job predicting differences in funds' future performance, with higher-rated funds faring better than lower-rated funds, on average. This is evidenced by the stair-step pattern in each chart below, which shows the average excess returns of rated funds over various event horizons.
Trailing Average Excess Net Return vs. Category Average, by Medalist Rating
The Medalist Rating has succeeded in sorting funds based on future performance when measured against the assigned Morningstar Category averages.
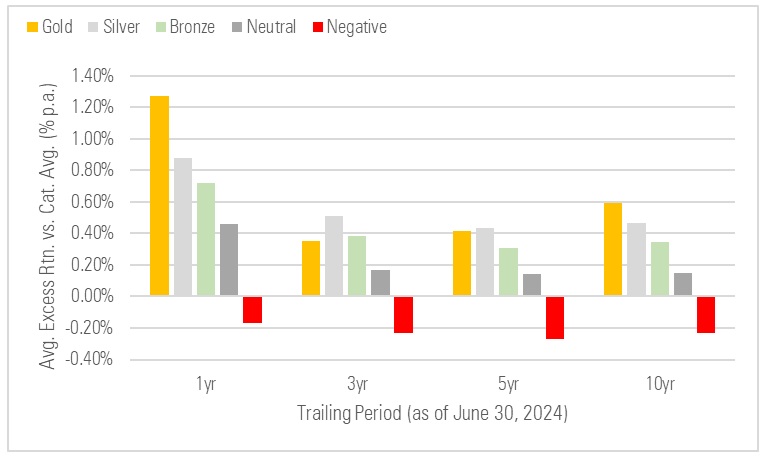
Source: Morningstar. Data as of June 30, 2024. Average excess net return versus assigned Morningstar Category average.
Trailing Average Excess Net Return vs. Category Index, by Medalist Rating
The Medalist Rating has succeeded in sorting funds based on future performance, with higher-rated funds faring better than lower-rated funds. However, highly rated funds did not generate higher average excess returns than their assigned indexes, on average.
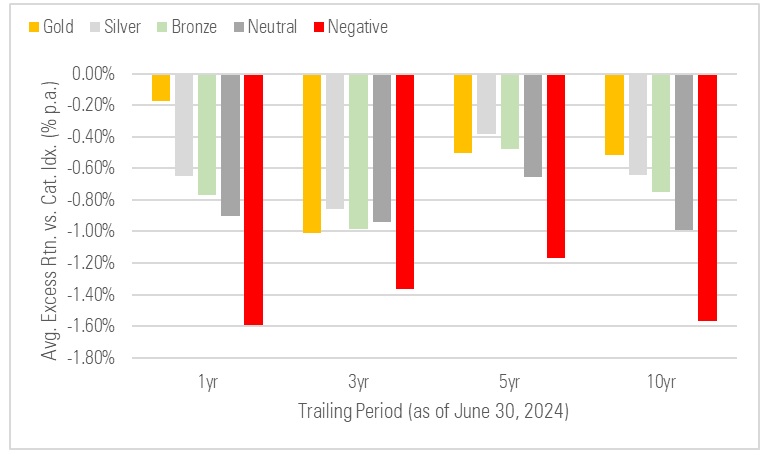
Source: Morningstar. Data as of June 30, 2024. Average excess net return versus assigned Morningstar Category index.
That said, highly rated funds haven't outperformed their benchmark indexes, on average, as shown in the second chart. This informs our motivation to enhance the Medalist Rating to improve the likelihood that the highest-rated funds will outperform their assigned indexes.
What We're Changing
To understand what we're changing, it's useful to review what we're assessing to begin with. In essence, we're comparing two things to arrive at a Medalist Rating: 1) How much value we believe a fund can generate versus its index before fees based on our evaluation of its investment merits and 2) the fees it levies. The difference, which reflects how much value we conclude a fund can add after fees, determines the Medalist Rating we assign.
We're planning to change the first of these two elements—the way we estimate how much value a fund can generate before fees compared with its assigned benchmark. In general, we're reducing this estimate and, in the process, lowering our forecast of how much value a fund can deliver after fees.
We are shifting away from an approach that has relied on the historical dispersion of the value, or "alpha," that funds of a particular type delivered before fees. We're replacing it with an approach that better accounts for the likelihood and magnitude of delivering positive value before fees.
In many cases, this will lower our estimates of how much value funds can generate before fees, as the dispersion-based estimates we've utilized to this point (which we refer to as the "semi-interquartile range") exceed the expected before-fee value estimates we'll employ going forward.
Why We're Making the Change
While dispersion boasts simplicity and can convey useful information about the range of outcomes before fees, it can face drawbacks when the distribution of alphas skews negative. Specifically, in instances where there's a wide dispersion of before-fee alphas but the median alpha is less than zero, a dispersion-based measure can lead one to overestimate how much potential value a fund can be expected to generate before fees.
We illustrate this approach in the chart below, which plots the rolling 36-month alphas of all funds that have been classified in global large-blend categories (which includes the US large-blend Morningstar Category as well as categories like it for funds domiciled elsewhere in the world) since 2002. The dotted line represents the semi-interquartile range.
Historical Distribution of Before-Fee Alphas Generated by Large-Blend Funds
The distribution of before-fee alphas is shown, along with the 25th and 75th percentiles in the distribution and half the distance between them (the "semi-interquartile range").
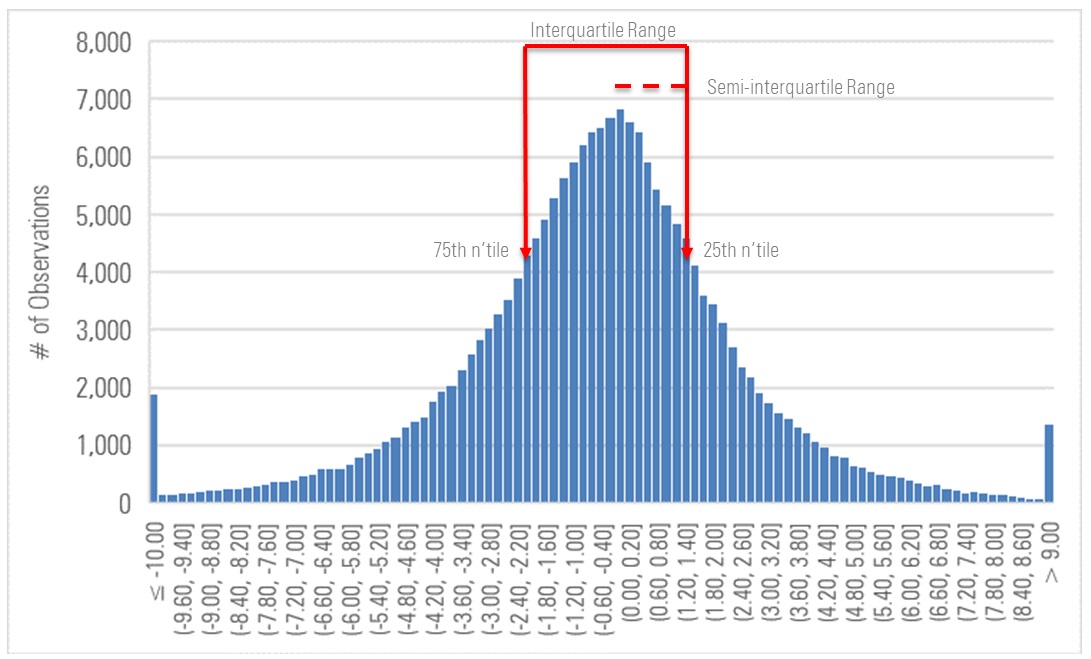
Source: Morningstar. Data as of June 30, 2024. The oldest share class of all funds assigned to the US large-blend Morningstar Category and other categories like it in other domiciles; rolling 36-month before-fee alphas vs. the Russell 1000 Index from Jan. 1, 2000, through June 30, 2024.
The approach we're adopting considers the percentage of outcomes that were positive and then, among those positive outcomes, the median alpha before fees that funds were able to generate. Under the enhanced approach, we'll multiply this percentage by the median positive before-fee alpha to arrive at our estimate of how much potential value a fund can be expected to deliver before fees.
We illustrate that approach below, again using the distribution of before-fee alphas generated by large-blend funds as our example. We've magnified the positive portion of the distribution and the median before-fee alpha in that part of the distribution.
A Close-Up of the Positive Region of Before-Fee Alpha Distribution for Large-Blend Funds
This chart magnifies the positive region of the before-fee alpha distribution, with the median positive before-fee alpha shown.
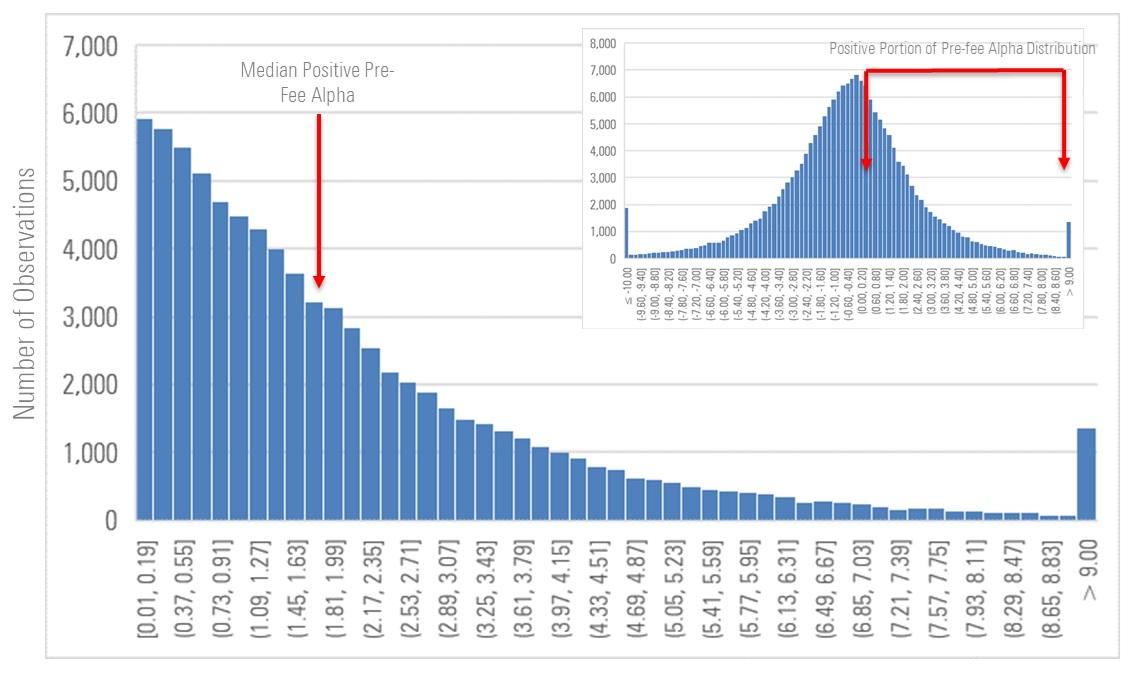
Source: Morningstar. Data as of June 30, 2024. The oldest share class of all funds assigned to the US large-blend Morningstar Category and other categories like it in other domiciles; rolling 36-month before-fee alphas vs. the Russell 1000 Index from Jan. 1, 2000, through June 30, 2024.
Expected Impact of the Change
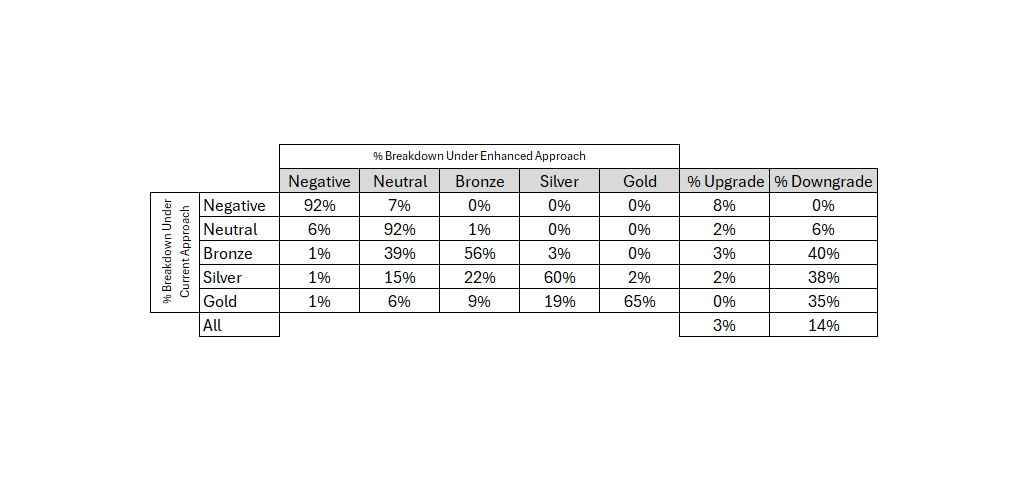
We expect 18% of rated funds globally to see a rating change due to this methodology adjustment, with most of those being one-rung downgrades. For instance, we expect that around 40% of the funds currently assigned Bronze ratings globally will be assigned Neutral ratings after we implement the change.
Change Matrix, All Funds Globally
All told, we expect 18% of rated funds to see a rating change, with most of the changes being downgrades. We expect funds rated Gold, Silver, and Bronze to see higher rates of change than those rated Neutral or Negative. Most rating changes will be one-rung differences.
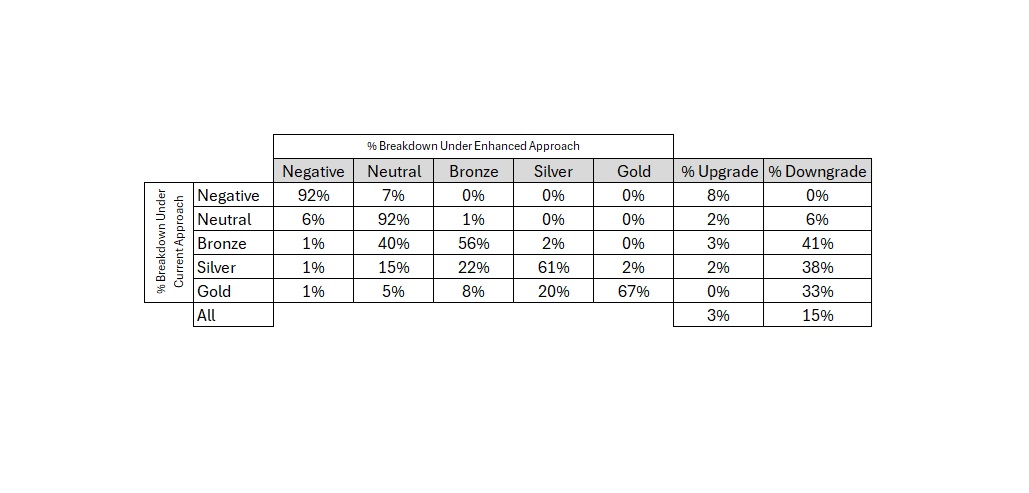
Source: Morningstar. Data as of July 31, 2024. Includes all rated vehicles globally.
In the following tables, we share the pro forma impact of the changes by asset class and coverage type.
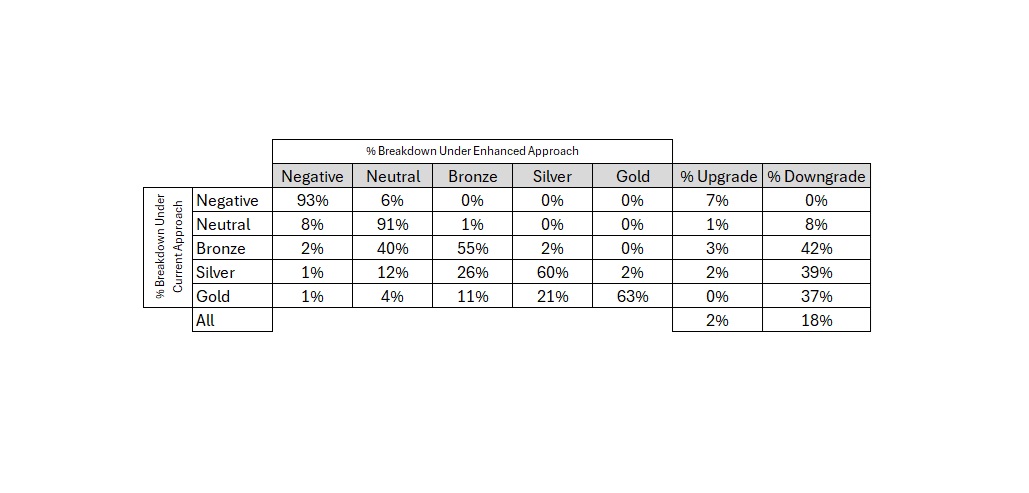
Change Matrix, Allocation Funds
We expect around 18% of allocation funds to see a rating change. We expect nearly 60% of Bronze-rated allocation funds to see a downgrade.
Source: Morningstar. Data as of July 31, 2024. Includes all rated vehicles globally.
Change Matrix, Alternative Funds
We expect fewer alternative funds to see rating changes than other types of funds. This owes to the fact that we estimate before-fee alpha potential for alternative funds differently than we do other types of funds.
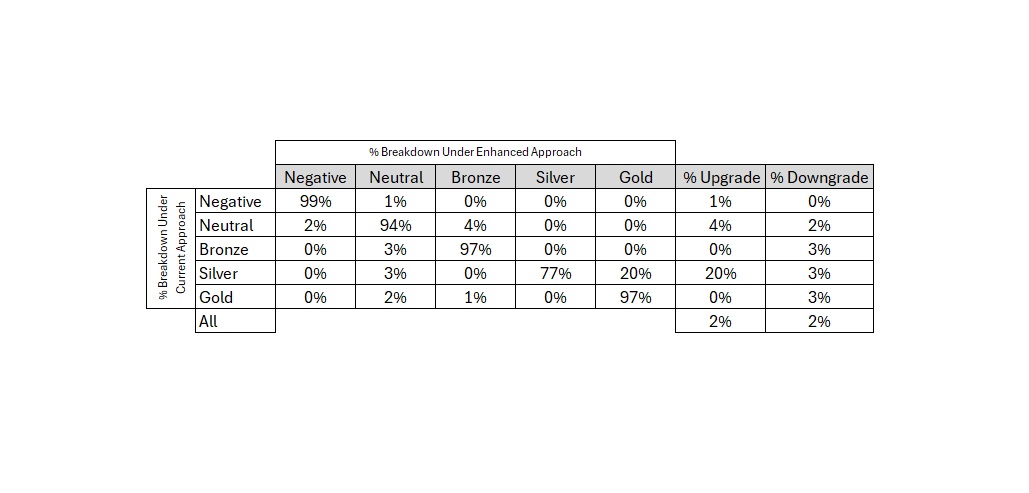
Source: Morningstar. Data as of July 31, 2024. Includes all rated vehicles globally. Alternative funds will see fewer rating changes than funds in other asset classes because we do not employ alpha potential when assigning Medalist Ratings to alternative funds.
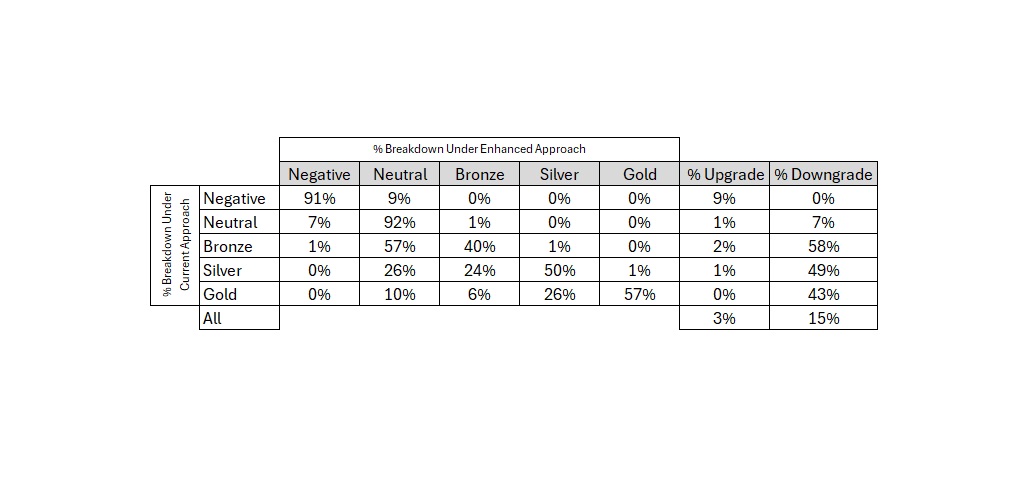
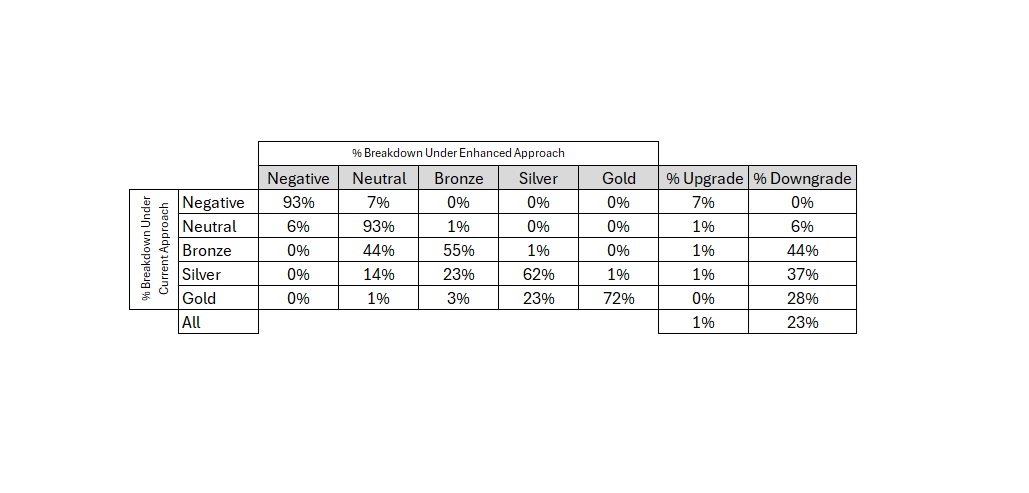
Change Matrix, Equity Funds
We expect around 20% of equity funds to see a rating change, mostly downgrades. We expect the change rate to be higher among Gold, Silver, and Bronze equity funds than Neutral or Negative funds.
Source: Morningstar. Data as of July 31, 2024. Includes all rated vehicles globally.
Change Matrix, Fixed-Income Funds
We expect around 13% of fixed-income funds to see a rating change, most of those downgrades. We expect roughly a fourth of fixed-income funds rated Bronze to see a downgrade.
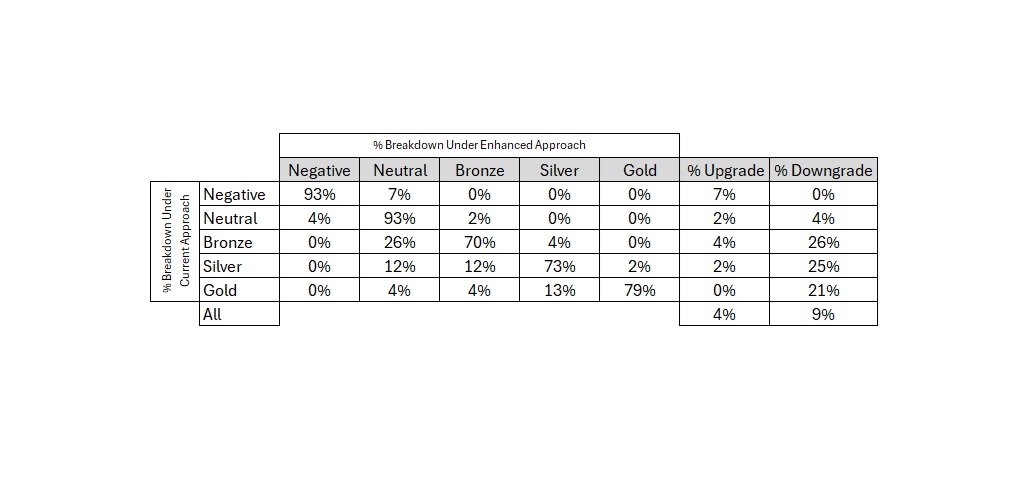
Source: Morningstar. Data as of July 31, 2024. Includes all rated vehicles globally.
We expect allocation and equity funds to see more rating changes than fixed-income funds. This reflects the fact that there tends to be greater dispersion of before-fee alphas among more-volatile strategies. Thus, the switch away from a dispersion-based measure of alpha potential to an approach that considers the likelihood and magnitude of positive before-fee alphas is expected to have a larger impact on allocation and equity funds than it will on fixed-income funds.
Change Matrix, Analyst-Assigned Ratings
We expect about 24% of the funds that have been assigned a Medalist Rating by an analyst to see a rating change under the enhanced approach. Nearly all of these changes will be downgrades.
Source: Morningstar. Data as of July 31, 2024. Includes all rated vehicles globally.
Change Matrix, Algorithm-Assigned Ratings
We expect around 17% of the Medalist Ratings assigned by algorithm to see a rating change under the enhanced approach, mostly downgrades.
Source: Morningstar. Data as of July 31, 2024. Includes all rated vehicles globally.
The higher rate of change among analyst-assigned Medalist Ratings is largely explained by the distribution of ratings. Namely, Gold-, Silver-, and Bronze-rated funds constitute a larger share of Medalist Ratings assigned by analysts than they do Medalist Ratings assigned by algorithm, and we expect these higher-rated funds to see more changes than lower-rated funds. This is why we expect a higher rate of change among analyst-covered funds than funds with algorithm-assigned ratings.
Timing of the Change
We expect the Medalist Rating change to go into effect on Oct. 29, 2024. The exact timing of when the change will be reflected in Medalist Ratings will vary depending on how the rating is assigned, as explained further below.
Medalist Ratings Not Assigned by Analysts
We expect the change to be incorporated into the Medalist Ratings of all funds not covered by an analyst on Oct. 29, 2024. These ratings are updated monthly and therefore we expect the change to be a part of the monthly production process that's scheduled for that day.
Medalist Ratings Assigned by Analysts
We expect the Medalist Rating change to be incorporated more gradually into the funds covered by analysts. For the change to be incorporated into a fund covered by an analyst, the analyst must update the rating of that fund. Analysts update these ratings about every 14 months as part of their regular coverage schedule. As such, we expect it will take around a year or so for the Medalist Rating change to be fully reflected in the ratings of funds covered by analysts.