Building a mental map for equity investing involves both qualitative and quantitative analysis: in short, the company's story, and asking whether the numbers add up.
In my past overviews, I've talked about focusing on the important and knowable factors when evaluating stocks, clues to look for to identify diamonds, and what to do to create your own financial misery – that is, what to avoid.
But often, ideas and business investment opportunities present themselves as numbers. Is starting with the numbers a good approach to spotting opportunities?
It certainly can be.
I have a pretty simple and fast process when looking at financials. It allows me to hone in on where to look and where to question when it comes to investment analysis.
Using this approach, I look for clues as to what the business model might actually be. Is it a revenue growth story? Is it a margin story? Is it cyclical? Is it capital intensive? What kind of returns on invested capital can it generate and how have those been trending? These questions help to build a mental model from financials first, rather than what business says or claims are its successes.
Morningstar Premium has plenty of financial data for individual companies, whether we provide analyst coverage on them or not. This data can be a useful starting point.
What is a Profit & Loss Account?
First, I look at the profit and loss (or P&L) statement.
Revenue growth is an important valuation driver. I mainly look at revenue growth and margins. In the former case, I want to understand if this business is growing quickly. Is it high single digits or more, moderately at mid-single digits, slowly at low single digits, or, worse, in decline?
Depending on what kind of growth rate the business has, it begs the question, where is growth coming from? Is it acquisitions, product rollouts, market growth, market share, etc. Understanding the qualitative source of growth can be an important factor to determine if it can continue or not. Does it come from acquisitions, or organically, or a mixture of both? And, if the business has had a setback, this can be an opportunity. Sometimes structural growth stories have a hiccup, so it depends on what drives growth.
As for margins, I want to understand if it's a high- or low-margin business. High margins can be associated with software businesses, for example, which are highly scalable, or luxury brands, where price and exclusivity become important drivers of demand.
If I observe low margins (say, mid to low single digits NPAT margin), then I become very interested in the capital efficiency of the business: that is, the level of sales relative to total assets. You may need asset turnover of two times or more to make the economics work. Or in the case of banks, for example, a lot of financial leverage.
DuPont analysis very simply breaks down the return on equity of a business. It breaks the after-tax return for every dollar of equity invested in a business into three key components: net profit margin (NPAT/sales revenue); asset turnover (sales revenue/total assets); and leverage (total assets/shareholders equity). The return on equity is the product of the three factors. The upshot is if net profit margins are low, then asset turnover needs to be high to generate high returns on equity. All else equal, we want high returns on equity because it means for every pound of equity in the business, it generates an attractive return.
What is Cash Flow and How do I Understand it?
Second, I usually look at the cash flow statement, starting with operating cash flow.
With operating cash flow, I want to see if a company's reported profit translates into operating cash flows, or just a mountain of assets on the balance sheet. Some capital-intensive businesses simply grow their asset bases in a boom, ploughing everything they earn in profit back into more stuff. Mining equipment hire company Emeco has fit this bill before, spending money to grow when the market is rising. It is a capital-intensive cyclical business, and its capital does not scale: i.e., to get bigger, it needs more equipment.
Seeing how much capital is going out the door helps me assess if the company is investing rapidly and if it is translating into commensurate profit growth. What I generally dislike is a combination of no free cash flow, and declining returns on invested capital. Large investments ahead of some future payoff can be an exception, but good businesses invest as they grow, and superior businesses require little capital to grow. In the hypothetical good business, you may see stable but attractive returns on invested capital as the business grows. For a superior business, you may get rising returns as the business grows.
What is a Balance Sheet?
When comparing return on equity, one factor to look for is financial leverage. This is debt, or money borrowed by a company to complete important projects. A business may earn slim margins, and slimmer margins than peers, but earn an attractive return on equity because of excessive financial leverage. Here, those returns can evaporate quickly.
In such cases, it’s important to consider the likely variability of revenues and earnings, and if financial leverage can trigger value destruction if a downturn occurs. We don't know when a downturn may strike, but we can have a go at understanding the consequences if it does.
There are a couple of ratios to look at to get an idea of financial leverage. I usually look at net debt/EBITDA, and if elevated – say above two – I might then also look at EBIT/net interest to see how much coverage the business has. While the large global miners have generally been well run since the last downturn in 2015/16, some had to raise capital in that downturn, Glencore (GLEN) included. And in the great financial crisis, Rio Tinto (RIO) had a large, discounted equity raise. When profits contract quickly, what looks like a reasonable amount of leverage can become risky.
Some types of leverage can be good though, such as free float. Berkshire Hathaway, while running a conservative balance sheet, has compounded returns in part thanks to free float from the insurance premiums. This is when policy premiums are paid by consumers to insurance companies in advance of claims, leaving a ball of money for the insurer to invest.
Importantly, this free float grows as the business grows, meaning a growing ball of money to invest and growing earnings from it. Insurance brokers, such as AUB, also benefit from free float as premiums are collected before they are paid to the insurers. Interest can be earned in the meantime.
Putting it All Together
Exhibit 1 below shows the return on equity assuming no financial leverage is dependent on asset turnover and net profit margin. I'll make two observations. Firstly, the greater the asset turnover i.e., the less capital intensive a business is, the higher the returns on equity.
Secondly, the higher the net profit margins, the higher the returns. A highly capital-intensive business needs high margins to make attractive profits and returns. While a capital efficient business can earn low margins and still make decent returns.
Hypothetical Unlevered Returns on Equity
Exhibit 1: Asset turnover (revenue/assets)
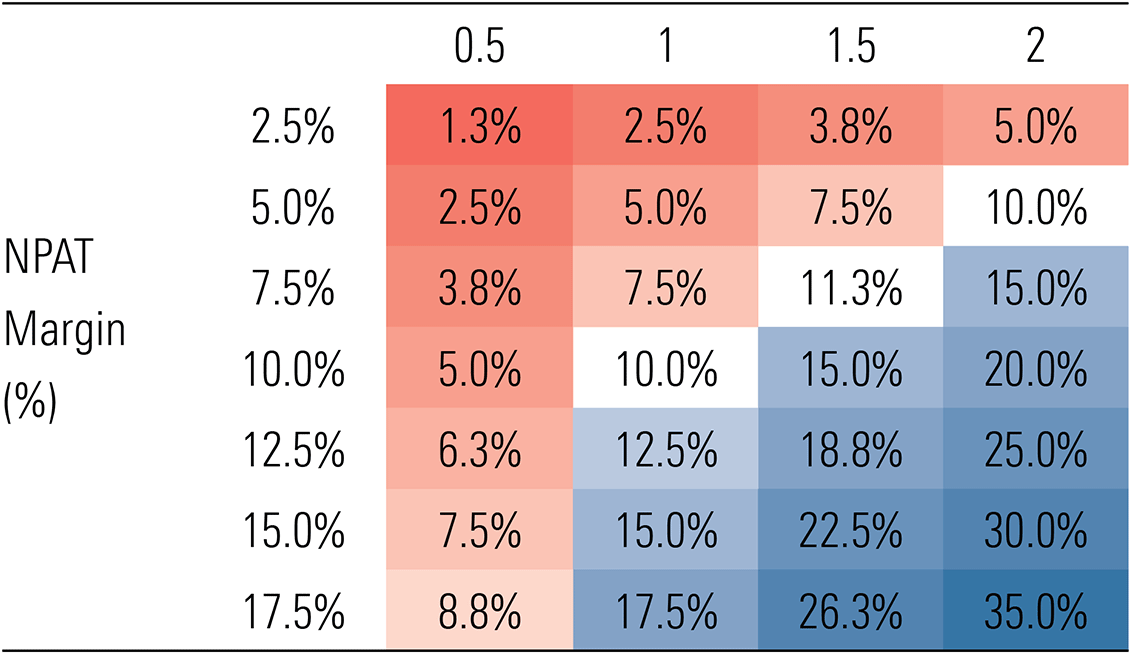
Source: Morningstar
To apply the data, the Exhibit 2 below shows our year one forecasts for the components of the return on equity for our best ideas. We can see returns for Resmed, ASX and Santos are driven by high margins, so here, our comfort around the ability for high margins to continue is critical. For A2 Milk and Ventia, capital efficiency, shown by asset turnover above two, is the key driver of attractive returns. AUB is an interesting case, benefiting from financial leverage despite having net cash. It shows the benefit of good leverage from free float.
Exhibit 2: Components of Return on Equity For Our Best Ideas
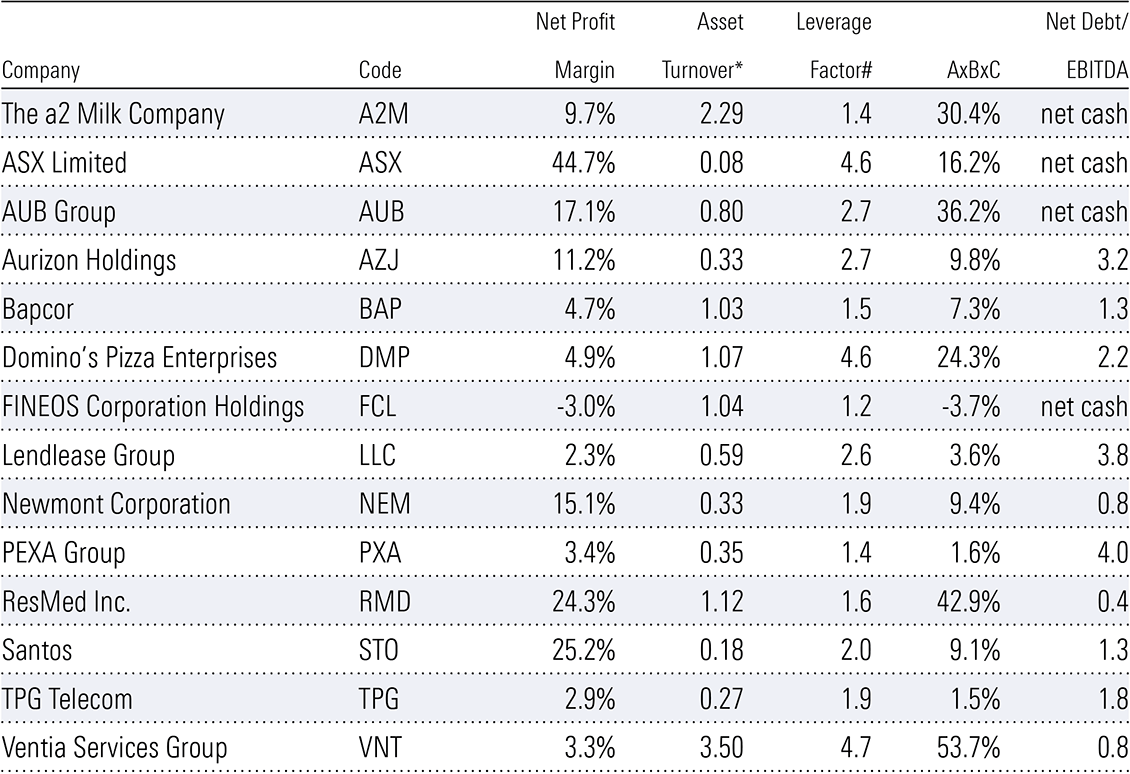
Source: Morningstar. * Excludes goodwill, cash and investments. # Total assets/shareholder equity.
Aurizon stands out with low asset turnover but generates solid returns on equity through leverage from debt. In this case, financial leverage is reasonable given the reliable underlying contracted revenues. Some businesses, such as TPG and Fineos, are underearning now. The product of net profit margins and asset turnover looks poor. But for these two we expect revenue growth and fixed cost leverage to expand margins and profits.
This article has been edited and republished for a UK audience