
You surely have heard that the US stock market is too concentrated, resting its fortunes on a small number of technology stocks. Such claims are ubiquitous.
Just last week, I watched an investment professional telling an industry audience that because the S&P 500's top holdings so influence the index, private pension accounts have become perilously non-diversified. Many heads nodded in agreement.
I disagree. Even investors who own only a US equity index fund hold more than 70% of their assets outside of the "Magnificent Seven" stocks, which are Alphabet (GOOGL), Amazon.com (AMZN), Apple (AAPL), Meta Platforms (META), Microsoft (MSFT), Nvidia (NVDA), and Tesla (TSLA).
And such pension participants are rare. Vanguard reports that only 1.3% of its 401(k) plan participants invest in a lone equity fund. The other 88.7% own either multiple funds or a target date fund.
The chart below displays the Magnificent Seven's weighting in four Vanguard funds: 1) 500 Index (VFIAX); Total Stock Market Index (VTSAX), Target Retirement 2055 VFFVX, and 4) Target Retirement 2025 (VTTVX). Whether the first two funds have too much money in too few securities can be debated. The latter two, though, are relatively safe – and they are far more typical of 401(k) pension accounts.
(Although Target 2055 invests 90% of its assets in equities, its Magnificent Seven exposure is greatly reduced because of the fund's overseas holdings. The same principle applies to other target-date series, as all diversify internationally.)
These Stocks Are Bigger Now
That said, the concern about overconcentration must have some basis. Otherwise, why has the assumption become so prevalent? To assess the proposition, I evaluated the distribution of corporate profitability. Specifically, I took the profits generated by 1) that year's highest-earning firm, 2) the five highest-earning businesses, and 3) the 10 highest-earning companies, then divided those totals by the summed earnings of the 100 highest-earning US companies. The results for 2013, 2018, and 2023 appear below.
Profit Concentration: Recent History
The people are correct. In 10 years, the profit share from the five largest companies spiked from 18.9% to 30.7%, while that for the top 10 firms increased from 31.8% to 43.4%. Without question, the leaders have strengthened their positions.
But Were Even Bigger Then
This, however, is merely the current view.
I hoped to place it in perspective by considering the longer history – back to the 1950s, if possible. To my delight, I managed to track down the relevant information. Although Morningstar's equity database does not date back that far, an archived list of Fortune 500 members, published by CNN, did the trick. That source provides the earnings for each Fortune 500 constituent, from 1955 through 2005. Here is a sample.
Copying, pasting, and calculating the relevant percentages for each year is beyond the call of an internet columnist's duty, but I did conduct the task for each half-decade from 1958 through 2023 (with the post-2005 results obtained through Morningstar Direct.)
As before, I measured the percentage of the total profits recorded by the country's 100 highest-earning firms that came from the year's single most profitable company, its five most profitable, and its 10 most profitable.
Profit Concentration: Longer History
That picture tells a very different story. Over the past 30 years, the leading companies have indeed consolidated their power. Once dozens of organisations competed in the primary technology battlegrounds: mainframe computers, personal computers, and software. Not anymore. These days, the biggest organizations have pushed their rivals to the margins. For example, Apple and Samsung (SMSN) jointly own more than half the global smartphone marketplace.
This, however, is not the first time that the leading businesses have been so powerful. As the chart indicates, we have been to this place before – and then some. To be sure, the names and industries were dissimilar. In 1963, when the 10 most successful businesses booked 51% of the top 100′s profits, the winners consisted of five oil companies, two auto manufacturers, two conglomerates, and a lone technology provider, IBM (IBM). None of the companies cracks the current list.
Intuitively, that American industry was once even more top-heavy than it is today makes sense. Although few of us directly experienced the stock markets of the 1950s, we can likely recall the adage that what was good for General Motors (GM) – and before that, US Steel –was good for the country. Big business was fashionable. Three companies controlled 94% of the vast domestic automobile market. DuPont (DD) employed more chemists than did all American universities, combined. And Ma Bell, of course, managed every telephone line.
The Bottom Line: Investment Risk
Despite the presence of those giants, which dominated stock market capitalisation even more than they did profitability – in the late 1950s, three stocks accounted for almost 30% of the S&P’s value – that era is not remembered for its stock market volatility. Which leads to the question: are narrow marketplaces riskier? Such is certainly the common belief. But rarely is it tested.
Now is the time. The next chart plots the profit percentage of the five highest-earning companies (again, divided by the profits of the 100 highest-earning firms) in blue against the future five-year standard deviation of the stock market in red. Yes, the graph is messy. But its conclusion is simple: To the extent that a relationship between the two factors exists, it seems to be negative. That is, the higher the profit percentage for the top five holdings, the lower the market's volatility.
Portfolio Concentration & Stock Market Risk
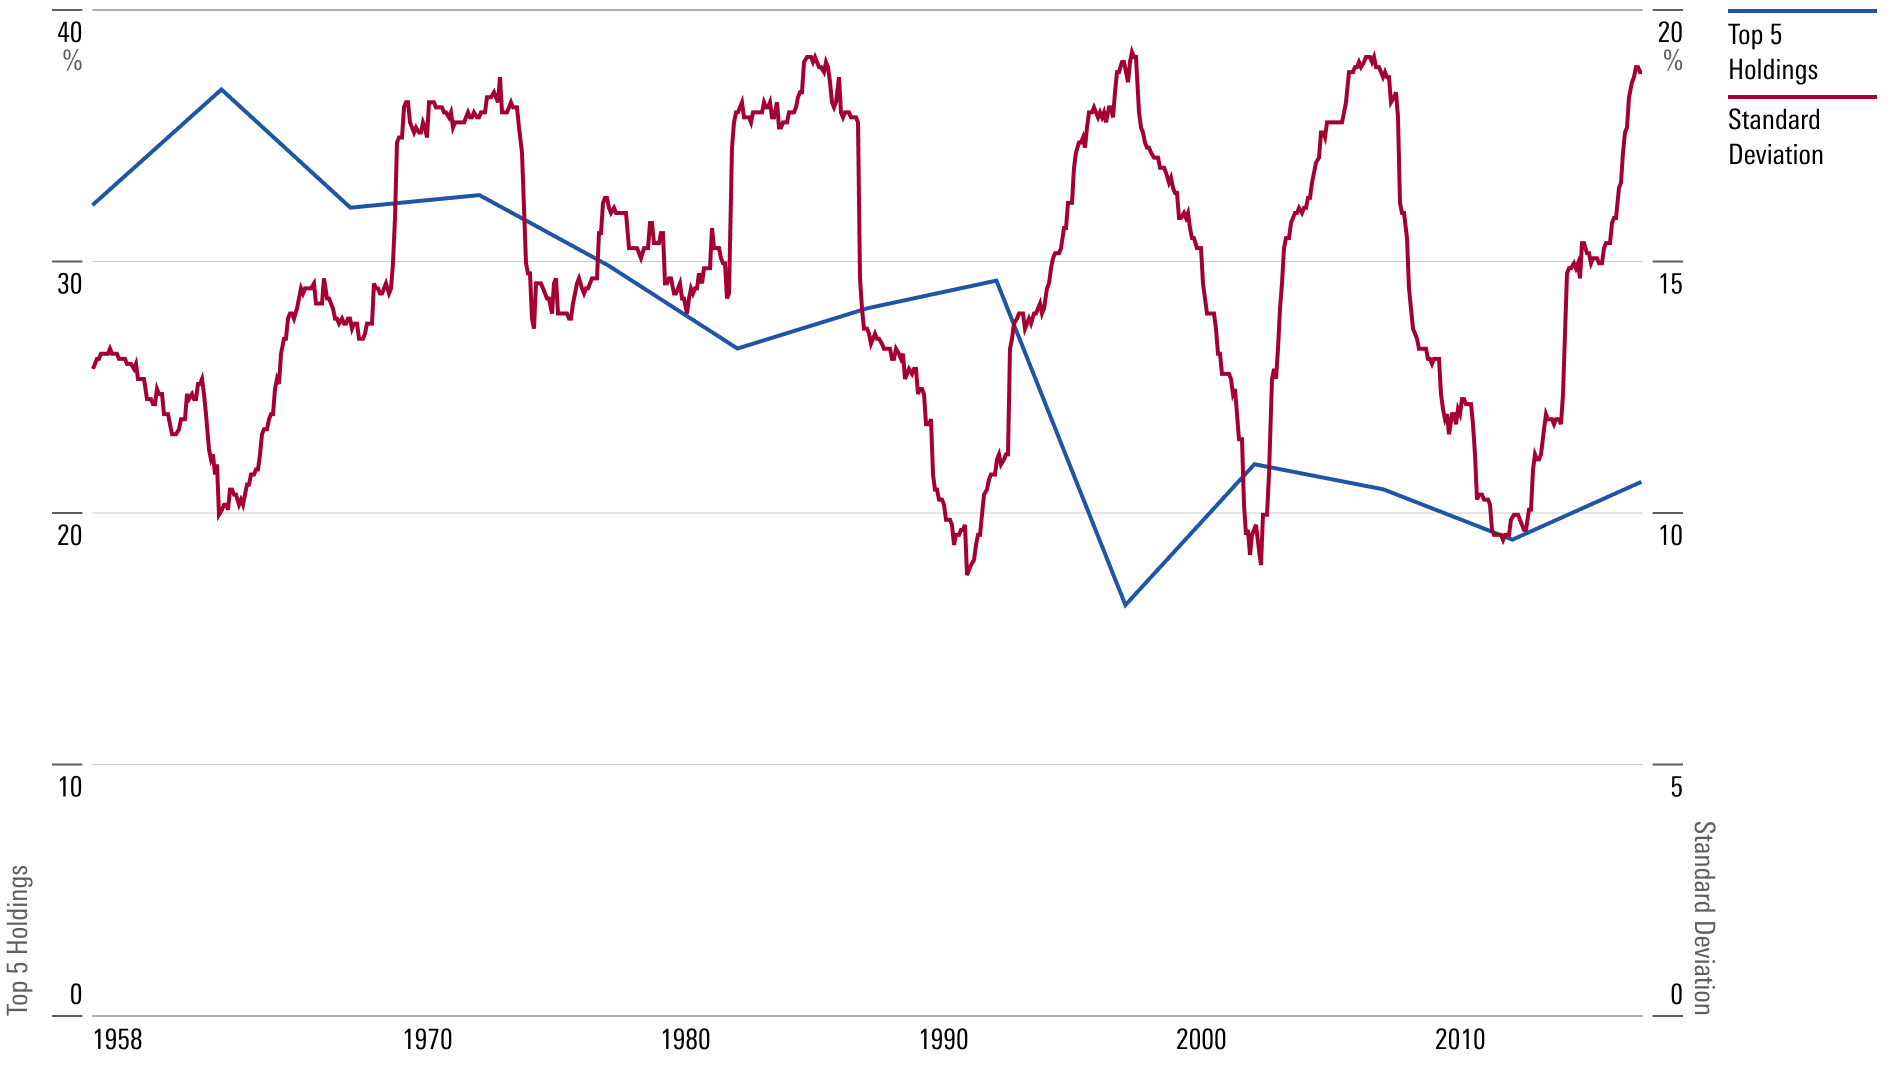
I do not believe that finding is meaningful. Rather, it is an accidental link that suggests that concentration is only tangentially related to stock market risk. Inflation, recession, and the aftereffects of speculation (as with the 2000-02 downturn) matter a lot. Whether corporate wealth is spread thinly or broadly, not so much.
Note: This article was inspired by a blog from Acadian Asset Management by Owen Lamont, called Magnificent Ignorance About the Magnificent Seven. As you will see if you read it, the material in this column is my own. But the initial idea came from elsewhere.
Correction: In a previous version of this article, the math behind evaluating the distribution of corporate profitability was reversed. This has been corrected.


.jpg)