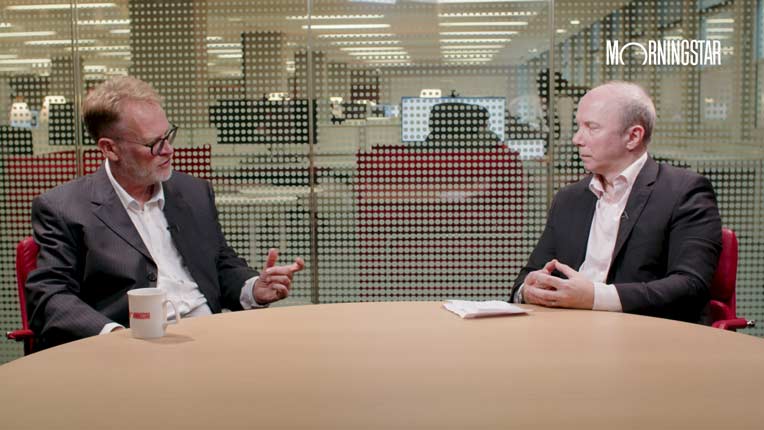
The yield curve is currently “flashing amber to red”, but this time the downturn indicator may not indicate a recession is imminent, according to Neptune’s James Dowey.
Pessimistic economists have been flagging the possibility of a recession occurring, slated for around 2020. The yield curve, the most popular being the 10-year Treasury yield minus the two-year Treasury yield, has been the most accurate predictor in recent history.
Generally, once the curve inverts – the two-year Treasury bond starts to yield more than the 10-year Treasury bond – it means a recession will occur within the next 12-24 months.
At the time of writing, the 10-year bond paid 3.06%, compared to 2.81% from the two-year paper. At 25 basis points, that’s the tightest the spread has been since around mid-2007, just before the great financial crisis.
“It is the number one recession indicator bar none and right now it’s flashing amber with a hint of red emerging,” asserts Dowey, chief economist at Neptune. “It’s going to invert over the next six months. A couple more rate hikes from the Fed should do it, and we’re going to be in recession territory.”
However, he counters, while it would be complacent to wave such fears away and say ‘this time it’s different’, much like then Fed Governor Ben Bernanke did back in 2006, there are reasons to think this time it really is different.
What Drives the Yield Curve?
Dowey explains that there are two underlying fundamentals that drive the slope of the yield curve. “One of them tells you about the chances of a recession, the other has nothing to do with it.”
The component that most accurately predicts a recession he calls the growth/recession expectation indicator. Simply, it is where the market – through bond futures contracts – believes the short rate will be in 10 years’ time minus where the market thinks the short rate will be in two years’ time.
When that component flattens, or inverts, it tells you the market is anticipating that the Fed is going to have to cut rates in the future in order to deal with a recession.
That component has come down a bit, but it’s still comfortably in positive territory, whereas prior to previous recessions this factor had dipped into negative territory.
The main driver of the yield curve’s current plunge towards inversion is the second component, the term premium. This is the return investors demand for holding a 10-year Government bond over a two-year Government bond.
“What we’ve seen this time around is that it’s the term premium that’s collapsed rather than the recession indicator,” Dowey says. And that dynamic has happened before. In 2016, the term premium turned negative and the yield curve flattened.
The reason the term premium has flipped and investors are currently demanding more for short-term debt than long-term bonds is quantitative easing. “QE is simply term premium targeting,” Dowey claims.
The bond-buying programme introduced in the wake of the great recession was intended by the US central bank to drive down the term premium and research by Fed economists in April 2017 suggests QE pushed the term premium on 10-year Treasuries down by 100 basis points.
This should reverse over time as the Fed rolls back QE and enters tightening mode, but the effects of quantitative tightening will take time to come through. Still, it’s one reason investors may not need to worry about the yield curve just yet.
Other Reasons to be Sceptical
Stefan Kreuzkamp, chief investment officer at European asset manager DWS, concurs with Dowey’s objection surrounding QE’s distortion of 10-year bond yields. “In order to compare the current yield curve with historical precedents, one would have to deduct this ‘artificial’ decline in yield,” he says.
And there are two further reasons Kreuzkamp shares Dowey’s scepticism of the yield curve as a recession predictor this time around.
First, any analysis looking at the two-year and 10-year yield differential does not take into account actual interest rate expectations, which the Fed now publishes.
“We would instead recommend considering a money-market rate, or the central bank’s policy rate directly,” explains Kreuzkamp. The current slope between he fed funds rate and the 10-year bond yield suggests the next recession won’t come around until at least 2022.
Second, there is little precedent for the US’s huge swathe of tax cuts and fiscal spending increases this late in the cycle, meaning it’s hard to assess how they might impact the yield curve.
“the most commonly used yield curve would suggest the start of a recession late in 2020,” concludes Kreuzkamp. “However, we find a lot of objections and, in the current environment, we would be particularly cautious about taking the yield curve at face value.”


